Where Can We Find Even More Savings? Hint – Focus on the “Other”
Let's Save Energy
Alliance to Save Energy's Blog

This post is the fourth in a four-part series that analyzes the evolution of Annual Energy Outlook’s (AEO) forecasts to show how major federal policies have changed the shape of our energy future, how these and other policies have impacted certain sectors of the economy and where opportunities for additional savings remain untapped.
In the first and second posts of this series, I analyzed how the Energy Information Administration (EIA) Annual Energy Outlook (AEO) forecasts have changed over time under the influence of energy policy changes. In the third post, I looked into some of the alternative cases that EIA developed in order to quantify the relative impacts of more aggressive energy efficiency policies. And in this final post of the series, I will dig in further to the assumptions in these alternative cases to see where uncaptured savings may be waiting to be discovered.
To generate their residential and commercial forecasts, EIA must make assumptions about what equipment will be used in future homes and businesses. EIA builds up its forecasts by starting with what is already installed and layering in assumptions about how often equipment is replaced based on its expected useful life. It then factors in how energy-efficient products on the market will be (which is influenced by appliance standards) and finally determines what products customers will purchase when they have to replace their equipment. Finally, EIA overlays the number of hours that equipment will be used, which in turn is influenced in part by a forecast of future demographic trends and regional heating and cooling needs.
At the end of this process, EIA has the equipment stock (i.e. how many of each appliance is operating by end-use category by fuel type by region), the equipment efficiency (how efficient the average appliance is), and the number of hours each appliance is used. These are multiplied together and added up to determine how much energy is consumed in each category for each year in the forecast period. At the point, EIA aggregates energy use into common “end-use categories” such as space heating, lighting, and washing and drying clothes. This process is repeated for each alternative case with changes in the underlying assumption (such as the adoption rate of building codes) that influence each step in the process.
For the rest of this post, I will contrast the results of the AEO2014 Best Available Technology (BAT) case with the Reference case, with a focus on changes in use in the year 2030.
End-use Detail in the Residential Sector
As you might remember from the third post in this series, the BAT case is an alternative scenario in which customers generally choose the most efficient appliance that is available in the market and where future building codes are enhanced and adopted more quickly by state and local governments. As expected, the average efficiency of equipment in all categories – with one notable exception – is improved as compared to the reference case. Because the average efficiency is improved, the amount of energy that is used in each end-use category in the BAT case falls with respect to the Reference case. The chart below compares the two forecasts and shows total energy use for each major end-use category. In these charts, “FF & BP” is the furnace fan and boiler pump category.
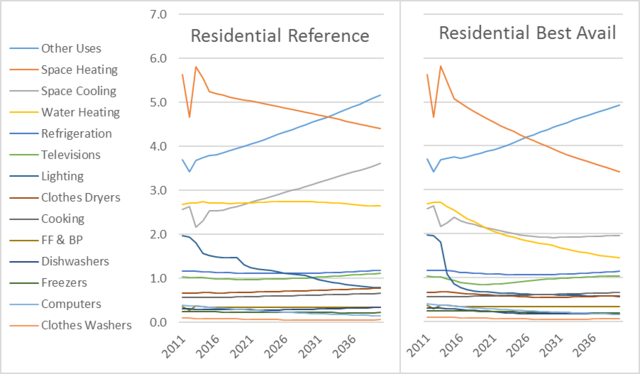
A few things to highlight from this chart. First, even in the Reference case, many categories of end use are flat or declining. This is largely due to the appliance standards and building codes that had already been adopted and incorporated into the model. However, the drops are much steeper in the BAT case, with lighting (dark blue), water heating (yellow) and space cooling (grey) dropping robustly. Second, the only line to increase in both cases is the “other uses” category. This is the “catch all” category, and is sometimes also called plug loads or miscellaneous electric loads (MELs). EIA includes small electric devices, heating elements, outdoor grills, exterior lights, pool and spa heaters and small motors not in other appliances in this category.
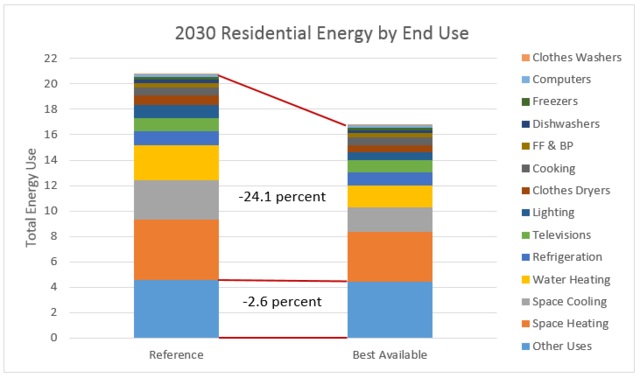
The next chart shows the difference between the projections of two cases in 2030. While total energy use has dropped by almost 20 percent, the savings are not distributed evenly. All categories except other uses fell by 24 percent, but other uses only fell by 2.6 percent.
This last chart compares the drop in each end use category to see where the largest percentage savings were realized (below the line) as well as the percentage of total energy use that comes from each category (above the line). These categories are listed left-to-right from largest to smallest 2030 BAT case total end use energy.
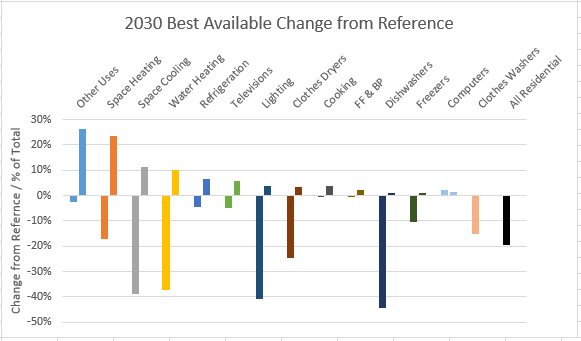
A few observations can be made. By 2030, the other uses category has grown to be the single largest end-use category, exceeding space heating, and uses more energy (26.4 percent) than the nine lowest categories combined. Not only that, but the reduction in the uses of these small appliances is almost non-existent (2.6 percent) when compared with deep drops in categories such as space cooling (39 percent), water heating (37 percent) and lighting (41 percent). There is an ongoing discussion in the energy efficiency, advocacy community and national labs about this issue and how to best approach it. I am not proposing a solution here, but it is clear from EIA’s projections and from the work of many other organizations that this is an area of untapped – and growing – savings potential that deserves focus.
Additionally, while space heating efficiency has improved somewhat, its improvement trails other major energy use categories such as space cooling, water heating and lighting. Part of this is due to the mix of technologies used for space heating. EIA models nine types of space heating equipment, with the top four – natural gas furnaces and boilers (51 percent of installed units), electric resistance heaters (23 percent), electric heat pumps (14 percent) and fuel oil furnaces and boilers (4 percent) – representing 91 percent of the Reference case 2015 installed base.
Natural gas powered heating systems alone represent just over half of all units, and their heating efficiency potential (heat energy delivered divided by energy input) is limited by thermodynamics to 100 percent and by reality to something lower. In the BAT case, the average efficiency of natural gas furnaces increases to 96 percent by 2030, an 11 percent improvement over the Reference case value of 86 percent. With even the theoretical limitation of 100 percent efficiency, there is not much room for further improvement beyond 96 percent.
Heat pumps (representing 14 percent of all space heating equipment) are able to move (or “pump”) more heat energy than they consume in the process, enabling heating efficiencies that exceed 100 percent and allowing for more improvement over time. EIA projects that electric heat pump efficiencies in 2030 will improve 33 percent to 320 percent (HPSF = 10.9) compared to the Reference case value of 240 percent (HPSF = 8.3).
Now, readers of this series will quickly point out that roughly two-thirds of the fuel energy that is used to produce electricity is lost before it can be used by the heat pump. But given the different thermodynamic methods that heat pumps use compared with furnaces and boilers, at some level of efficiency, an electric heat pump begins to use less total input energy than a natural gas furnace or boiler to deliver a unit of heat. This figure will depend on the efficiency of the power grid, which is increasing over time as more efficient generators replace older, less efficient generators. From a math standpoint, given today’s average power grid efficiency (33.25 percent in 2014), an electric heat pump with a HPSF over 9.45 will use less total energy than a 92 percent efficient natural gas furnace. While this level of performance may be attainable today with the most efficient products on the market, other critical considerations such as heating loads, local climate and relative costs must also be factored in when determining the best choice for a consumer’s space heat needs.
End-use Detail in the Commercial Sector
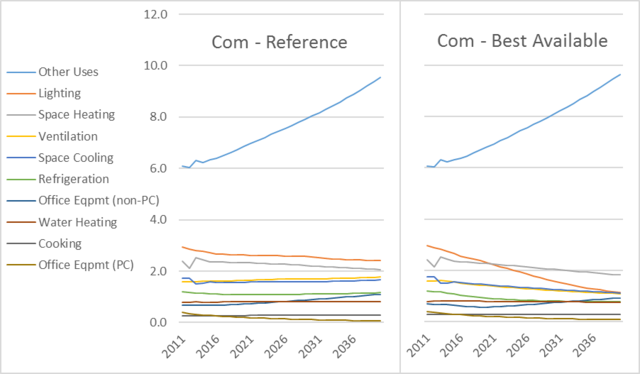
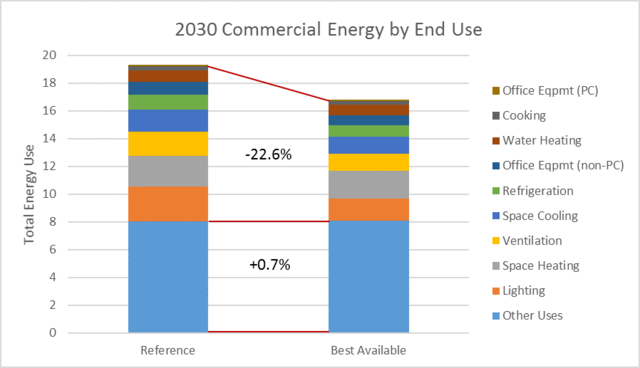
Similar trends exist in the Commercial sector, but the impact of the “other uses” category is even more stark. This category, visualized in the chart below, already dominates the sector’s total energy consumption, and as with the Residential sector forecast, is projected to increase substantially over time even in the BAT case. We see a clear impact of more aggressive standards in lighting, ventilation and cooling, but total energy use falls more slowly due to the increase in other uses.
We see in this next chart the energy use stack as it is projected to appear in 2030. All categories except other uses decline, and in 2030 they are about 23 percent lower in the BAT case than in the Reference case. But the energy consumption from other uses actually increases slightly, and given the much larger fraction of total energy use of this category, the total decrease in the Commercial sector is only 13 percent.
This final chart shows the end-use changes between the Reference and BAT scenario, highlighting the discrepancy between progress in the other uses category and all the rest. By 2030, the other uses category comprises nearly 50 percent of all commercial sector use, and usage actually increases between the two scenarios.
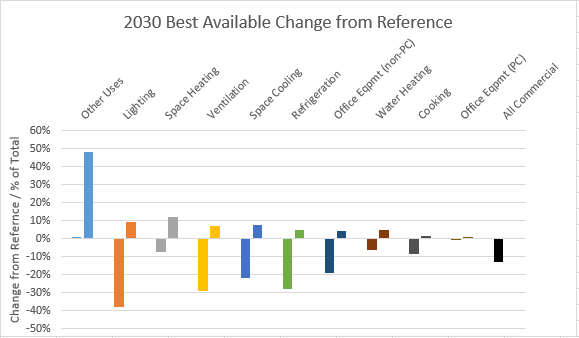
As with the Residential sector, the need to focus on other uses is obvious and compelling. Given that a high percentage of these products are electric, each unit of end-use saving will reduce another two at the power plant. If that one category were to have attained the same percent reduction between the BAT and Reference cases as the average of the rest of the categories, commercial sector savings would nearly double.
Wrapping It Up, and Going to BAT!
We have taken a relatively long journey through EIA’s AEO forecasts over the course of this blog post series. We started by looking at the evolution of the forecasts themselves as new policies came on line. Next, we discussed the impact on each of the four sectors that EIA analyzes, and sought to understand what factors were contributing to the steady falling and flattening of the forecasts. After that, we looked into three alternative cases that show deeper deployment of existing best-practices policies can create an even brighter energy and economic future. Finally, in this post, we looked “under the hood” at one alternative case to see what end-use categories were driving the savings in the residential and commercial sectors to help inform us where to focus our efforts going forward.
So what have we learned? If nothing else, hopefully the reader has a greater appreciation for the expansive data set that each AEO produces. I only covered three of the 30 alternative cases for one year, and in those examples, only looked into a few detailed data sets. AEO has much more to offer, and EIA has improved their tools for accessing the data substantially in the past few years.
But on the subject itself, I hope that the reader sees that there is a clear and navigable path forward to deeper energy savings and all the economic and environmental benefits that go along with them. Smart energy policies will increase our energy productivity, enabling us to grow our economy while still controlling our energy use. However, even as the path is starting to emerge, we must work diligently to stay on it.
Common sense energy policies such as robust building codes must be adopted and implemented more quickly by state and local governments. Industry and advocates must continue to work with the U.S. Department of Energy to improve federal appliance standards, and pay special attention to the “other uses” category in residential and commercial buildings. Efficiency standards for light, medium and heavy vehicles must continue to get stronger over time. States must adopt best practices such as Energy Efficiency Resource Standards and encourage efficiency through third party providers and utility-managed energy efficiency programs. Financing for residential and commercial retrofits must be deployed in huge quantities, while federal legislation such as the SAVE Act must be enacted to properly value the benefit of lower-energy homes.
But the good news is we know this can be done, because it has been done. Leading states are already deploying most of these policies, and they continue to be test beds to push the boundaries on how fast and how far they can reduce their energy use and carbon footprints.
Energy efficiency is the best first option to decarbonize our economies. Deploying energy-efficient policies, technologies and processes in the U.S. will increase our energy productivity, enable us grow our economies and lift up our residents to a more energy-secure future.
It’s time to get up and go to BAT!
RECENT BLOG POSTS


STAY EMPOWERED
Help the Alliance advocate for policies to use energy more efficiently – supporting job creation, reduced emissions, and lower costs. Contact your member of Congress.
Energy efficiency is smart, nonpartisan, and practical. So are we. Our strength comes from an unparalleled group of Alliance Associates working collaboratively under the Alliance umbrella to pave the way for energy efficiency gains.
The power of efficiency is in your hands. Supporting the Alliance means supporting a vision for using energy more productively to achieve economic growth, a cleaner environment, and greater energy security, affordability, and reliability.