How to Save Trillions of Dollars (Yes, Trillions with a ‘T’!) on our Energy Bills
Let's Save Energy
Alliance to Save Energy's Blog

This post is the third in a four-part series that analyzes the evolution of Annual Energy Outlook’s (AEO) forecasts to show how major federal policies have changed the shape of our energy future, how these and other policies have impacted certain sectors of the economy, and where opportunities for additional savings remain untapped.
In the first post of this series, I examined how the Energy Information Administration (EIA) Annual Energy Outlook (AEO) forecasts changed over time and shifted after the passage of the Energy Independence and Security Act of 2007 (EISA), which contained provisions to increase energy efficiency. In the second post, I analyzed how these policies impacted each sector of the economy – residential, commercial, industrial and transportation. In this post, I will turn to some of the alternative cases, which model the “what-if” scenarios of different variables that EIA developed to quantify the relative impacts of more aggressive energy efficiency policies. Spoiler alert – they are massive!
AEO’s Reference case forecast assumes that statues and regulations currently in place are frozen and will not change over time; as such, it only includes actual statutes and regulations that have been enacted. While this approach makes sense in the context of evaluating the impact of current policies, it does not help when trying to determine how changes to those policies might affect energy production and consumption. Fortunately, EIA develops a robust set of alternative cases that examine these “what if” scenarios in more detail.
For AEO2015, the 2015 Annual Energy Outlook report, EIA developed six alternative cases, mostly focusing on variation in economic growth and fossil fuel availability and prices. However, AEO2014 contained 30 alternative cases that spanned the gamut from economic variables, greenhouse gas policies, nuclear generation assumptions and energy efficiency adoption. (AEO2016 will contain a larger set of alternative cases as EIA has shifted to producing a “long” and “short” version of AEO in alternate years). In this post, I look more closely at three alternative cases that vary the scale and scope of energy efficiency assumptions to see how they impact future energy use and economic indicators.
These cases – High Demand Technology, Best Available Demand Technology, and Low Electricity Demand – change core assumptions about the deployment of energy-efficient technology in the market. Specifically, they alter the model’s assumptions about how strong future appliance standards will be, how quickly localities adopt building codes, and how many consumers choose to purchase more energy-efficient technologies for their homes and businesses. I created an additional Hybrid case that combines the most aggressive assumptions from each sector. The following table summarizes illustrative changes to the Reference case for the key forecast assumptions. Full details for each case can be found in AEO’s assumptions documentation.
Policy Lever | High Demand Tech | Best Available Tech | Low Electricity | Hybrid |
Appliance Standards | ++ | ++++ | ++++ | ++++ |
Building Codes | ++ | ++++ | ++++ | ++++ |
EE adoption rates | ++ | ++++ | ++++ | ++++ |
Vehicle fuel economy | ++ | Same as Reference | Same as Reference | ++ |
Industrial EE | Same as Reference | Same as Reference | ++ | ++ |
Comparing Possible Futures
First, a caveat. As AEO’s forecasts only includes policies that are enacted as of the time of the forecast’s development, AEO2014 Reference case does not include the Clean Power Plan or recently adopted appliance standards. It also contains fuel price forecasts that are considerably higher than those of today. Still, since these fuel price forecasts do not change between the selected alternative cases, the relative change between the forecasts is indicative of the effect of the policies.
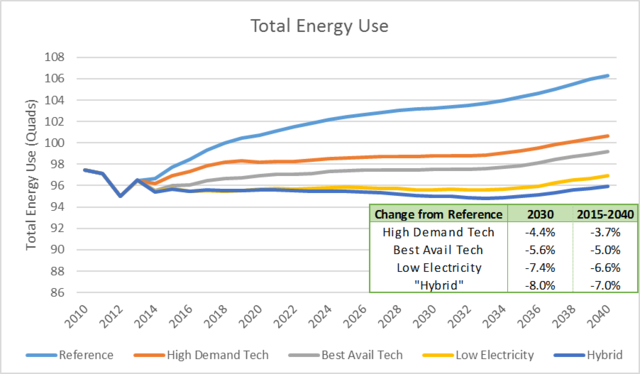
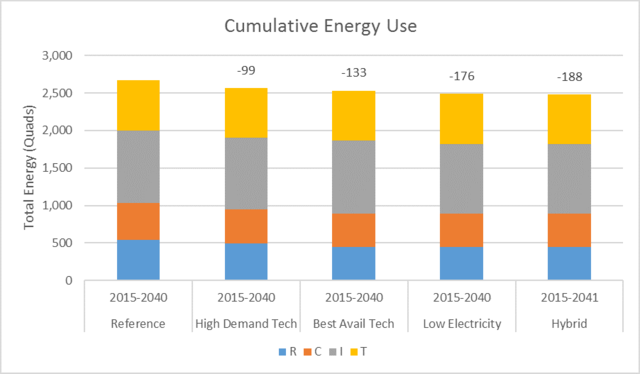
This first chart below shows total energy use for all sectors of the economy. This is the same data series that was discussed in the first post of this series and represents all energy from all fuels, including those used to make electricity. The difference between the alternative cases are both clear and substantial. By 2030, the most aggressive policy case would push energy consumption down by 8 percent (to 95.0 quads from 103.2 quads), while cumulative energy use between 2015 and 2040 (the area under the curve) would fall by 7 percent. The cumulative savings of the most aggressive case (188 quads) is enough to power the country for almost two years!
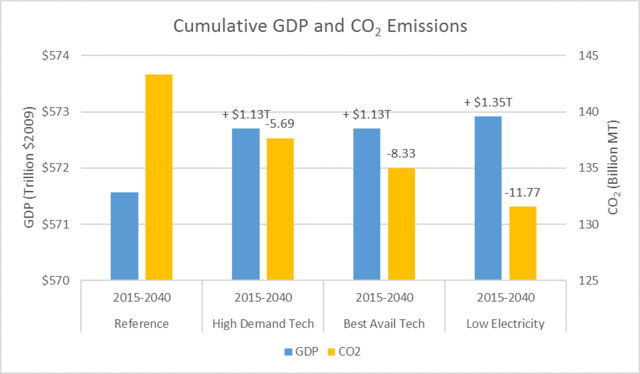
Not only do these changes save energy across all sectors of the economy, they actually increase the projected GDP and reduce carbon emissions of the U.S. Between 2015 and 2040, these cases project an increase between $1.13 and $1.35 trillion to the economy (unless otherwise noted, all figures in this post are in $2009 to avoid the impact of inflation), while decreasing cumulative carbon emissions equivalent to one to two years of total U.S. emissions (5,690 MMT to 11,770 MMT). And, in an unsurprising result, the forecasts show that the most aggressive case leads to both the highest growth in GDP and the largest reduction in CO2 emissions.
Impacts on Individual Sectors
Turning to each individual sector we see a familiar trend emerge: more aggressive energy efficiency policies lead to lower energy consumption. In each of the following charts, the Reference case is in blue, the High Demand Technology case is orange, the Best Available Technology case is grey, and the Low Electricity case is yellow. All units are quads of total energy use.
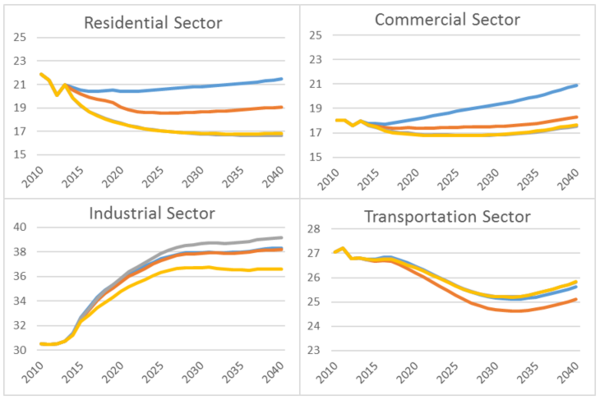
This table below summarizes for each sector the change in energy use in 2030 and cumulatively from 2015-2040. Here, we see deeper savings in the R and C sectors, indicative of the stronger assumptions for appliance standards, building codes and adoption of energy-efficient equipment. The I sector sees a relative drop in the Low Electricity case as high-efficiency motors are deployment more broadly, while the High Demand case is the only one that includes incremental T sector improvements.
| 2030 Change from Reference Case | 2015-2040 Change from Reference Case | ||||||
Alternative Case | R | C | I | T | R | C | I | T |
High Demand Tech | -10.5% | -9.3% | -0.1% | -1.9% | -8.7% | -7.8% | -0.3% | -1.5% |
Best Avail Tech | -19.4% | -12.9% | 1.9% | 0.2% | -17.2% | -10.9% | 1.3% | 0.2% |
Low Electricity | -19.2% | -12.8% | -3.2% | 0.2% | -17.0% | -10.8% | -3.2% | 0.1% |
Finally, this graph below shows how energy productivity (defined as the GDP output per unit of energy input) changes with each alternative case. As expected, given the increase in GDP and decrease in energy use, energy productivity climbs further with each step up in energy efficiency assumptions. Energy productivity levels occur two to four years earlier than in the “reference” case, and the cumulative benefits of those changes compounds over time.
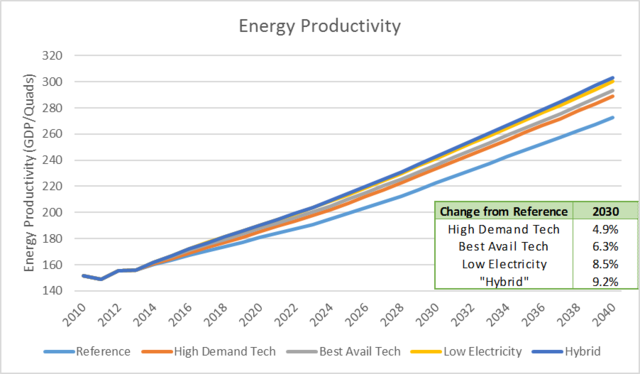
Importantly, none of these alternative cases require breakthrough technologies. They attain their savings primarily through the deeper adoption of energy-efficient products already on the market and the evolution of proven policies such as building codes and CAFE standards, which control standards for passenger vehicles, improving the economy of cars and light trucks over time. And these cases do not just help increase the overall GDP of the country, they are projected to save businesses and consumers literally trillions dollars in their energy bills over the next 25 years.
The Price Savings of Energy Efficiency
One of the many co-benefits of energy efficiency is that reducing demand for a product also reduces the price of that product. This effect – called the Demand Reduction Induced Price Effect or DRIPE – shows up clearly in EIA’s alternative scenario forecasts. The logic of DRIPE is simple, even if its name is not.
Energy efficiency and demand response eliminate the need for the marginal megawatt (MW) of power (that is, the last MW needed to meet a given level of demand). In our wholesale markets, power plants are typically dispatched (told to operate and produce power) in order from least expensive to most expensive. If the marginal plant is not needed to meet demand, then, necessarily, the most expensive MW is not used. In many competitive wholesale markets, the marginal generator sets the clearing price for all power plants, so reducing the cost of the marginal MW of power reduces the price paid to all generators that have been called on to operate. In other words, a small reduction in the cost of the marginal unit can add up to big savings for customers.
Over time, reductions in wholesale power prices translate into reductions in retail energy prices. And because more efficient appliances consume less power when running than less efficient appliances, growth in peak demand (i.e., the maximum load on the grid on hot summer days and cold winter mornings) will also slow over time. This means that expensive infrastructure that must be built to handle peak loads, such as new power plants, transmission lines and distribution substations, can be delayed or avoided altogether. This results in a further reduction of prices as power suppliers and utilities do not need to recovery those costs in their rates. Since this effect reduces energy prices for all users, not just those who reduce their own usage, DRIPE is a powerful co-benefit of energy efficiency for residents and businesses.
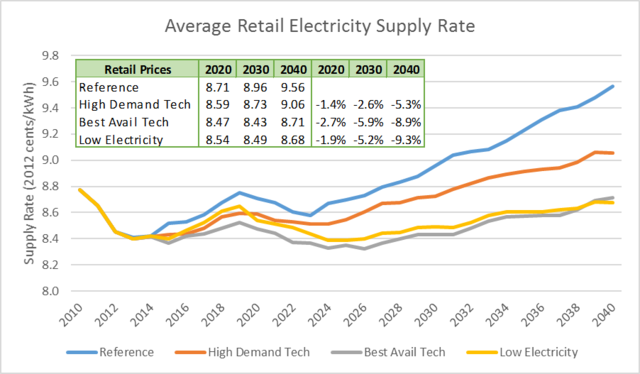
This next chart shows the impact on DRIPE on retail supply prices for all customers of electricity. While the Reference case has prices increasing 12.3 percent (before inflation) between 2015 and 2040, the most aggressive scenario sees increases of only 3.3 percent. By 2040, electricity prices in two scenarios are actually lower than they were in 2010!
Lower Prices are Good, but Lower Bills are Better
Of course, lower prices are good for everyone, even those who do not reduce their own energy use. But through the more aggressive deployment of energy-efficient appliances and higher performing buildings, the alternative cases show the combined impact of DRIPE and energy reductions on total energy expenditures.
The following charts show total non-renewable expenditures on energy in the Residential (R), Commercial (C), Industrial (I), and Transportation (T) sectors. This includes not only electricity and natural gas, but also gasoline and other petroleum products where they are used. Figures are in billions of dollars for selected years.
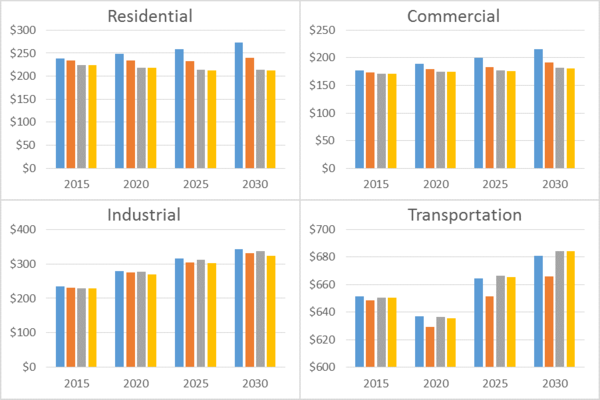
Energy expenditure savings in the R and C sector quickly exceed $10 billion per year, and by 2030, the more aggressive scenarios are saving residential customers between $30 billion and $60 billion per year, and commercial customers between $25 billion and $35 billion per year. The Hybrid case, which combines the most aggressive cases for each sector, reduces total energy expenditures by 8.5 percent in 2030.
Even better, the savings compound over time. Between 2015 and 2040, cumulative energy expenditures are projected to exceed $38.6 trillion in the Reference case. Savings from the alternate cases start at $1.9 trillion and increase to $2.9 trillion in the Hybrid case. Granted, consumers will pay some incremental cost for the more efficient equipment that they deploy, but given that utility programs and federal energy regulations are required to be cost-effective, these savings will substantially exceed those costs.
Total Expenditures by Sector | Change from Reference Case | |||||||||
2030 | R | C | I | T | Total | R | C | I | T | Total |
Reference | $273 | $216 | $343 | $681 | $1,512 |
|
|
|
|
|
High Demand Tech | $240 | $191 | $330 | $666 | $1,428 | -$32 | -$25 | -$13 | -$15 | -$85 |
Best Avail Tech | $214 | $182 | $338 | $684 | $1,418 | -$58 | -$34 | -$5 | $4 | -$94 |
Low Electricity | $213 | $181 | $324 | $684 | $1,403 | -$60 | -$35 | -$19 | $4 | -$110 |
Hybrid | $213 | $181 | $324 | $666 | $1,384 | -$60 | -$35 | -$19 | -$15 | -$128 |
2015-2040 | R | C | I | T | Total | R | C | I | T | Total |
Reference | $6,965 | $5,477 | $8,400 | $17,765 | $38,607 |
|
|
|
|
|
High Demand Tech | $6,263 | $4,929 | $8,110 | $17,411 | $36,713 | -$702 | -$548 | -$290 | -$355 | -$1,894 |
Best Avail Tech | $5,653 | $4,730 | $8,266 | $17,784 | $36,433 | -$1,312 | -$747 | -$134 | $19 | -$2,174 |
Low Electricity | $5,625 | $4,712 | $7,964 | $17,772 | $36,072 | -$1,340 | -$765 | -$436 | $7 | -$2,535 |
Hybrid | $5,625 | $4,712 | $7,964 | $17,411 | $35,711 | -$1,340 | -$765 | -$436 | -$355 | -$2,896 |
Figures in $2009 billion
Other Benefits Uncovered by the Alternative Cases
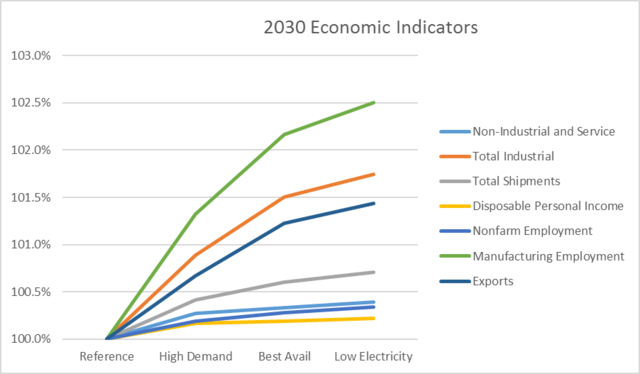
Finding that energy usage, prices and bills fall under the more aggressive energy efficiency scenarios is not surprising. Neither is seeing that GDP increases while carbon emissions decrease. But the economic benefits of aggressive energy efficiency keep rolling through the economy.
AEO reports high level macroeconomic figures for each of their cases. As one moves through the alternative cases, employment, manufacturing output, exports and personal disposable income all increase. The changes are sometimes small, but they tell a consistent story: more energy efficiency is better than less, and there is almost no practical limit on how much is too much.
Looking Ahead
So far, we have seen how policies implemented over the past decade have made major strides to reducing the business-as-usual assumptions about future energy use. We have also looked at the impact on each sector to see what changes are driving the reductions in use. In this post, we dug deeper into alternative paths forward, and showed that the more aggressive we are with implementing energy efficiency policies the better off we are. GDP goes up, CO2 emissions go down, and residents and businesses put trillions of dollars back in their pockets.
In the next and final post of this series, we will take a closer look at some of the end-use assumptions in the alterative cases to understand what is driving the savings, and what more can be done to push the ball even further forward.
RECENT BLOG POSTS


STAY EMPOWERED
Help the Alliance advocate for policies to use energy more efficiently – supporting job creation, reduced emissions, and lower costs. Contact your member of Congress.
Energy efficiency is smart, nonpartisan, and practical. So are we. Our strength comes from an unparalleled group of Alliance Associates working collaboratively under the Alliance umbrella to pave the way for energy efficiency gains.
The power of efficiency is in your hands. Supporting the Alliance means supporting a vision for using energy more productively to achieve economic growth, a cleaner environment, and greater energy security, affordability, and reliability.