The Evolution of EIA’s Residential, Commercial, Industrial, and Transportation Forecasts
Let's Save Energy
Alliance to Save Energy's Blog

This post is the second of a four-part series that will analyze the evolution of Annual Energy Outlook’s (AEO) forecasts to show how major federal policies have changes the shape of our energy future, how these and other policies have impacted certain sectors of the economy, and where opportunities for additional savings remain untapped. Read part one here.
In the first post of this series, I examined how the Energy Information Administration (EIA) forecast of U.S. energy markets, known as the Annual Energy Outlook (AEO), shifted after new energy efficiency policies were established with the passage of the Energy Independence and Security Act of 2007 (EISA). I also introduced the concept of energy productivity as a metric to compare the relative growth of the economy and energy use. In this post, I will dig into sector-specific forecasts to highlight how energy policies enacted in and since EISA continue to drive energy reductions.
AEO forecasts are broken down into four key sectors: Residential (R), Commercial (C), Industrial (I), and Transportation (T). We will first look at the general breakdown of energy use in the economy by sector and fuel use, and then analyze each sector in turn to see how policies and programs have changed the trajectory of EIA’s forecasts over the past 12 years.
Energy Use in the U.S.
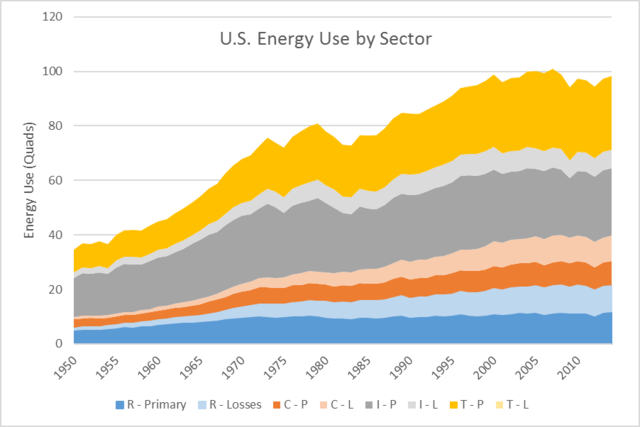
EIA defines two main categories of energy use: primary and total. Primary energy use represents the actual end-use energy consumed by the sector, while total energy use includes the fuel required to make the energy that is ultimately consumed by the sector. The difference between these two figures comes from the generation of electricity. Only about one-third of the actual energy content of fuels used to produce electricity eventually makes it to the electric socket for use in homes, businesses or industry. The rest is lost due to thermodynamic limits of generators, on-site use by power plants and line losses of the transmission and distribution system. The information in this series looks at total energy, which adds back in electric generation losses proportionally to each sector.
The following chart shows energy use in each sector from the year 1950 on. The lighter shaded area represents electric losses that have been allocated to each sector. The T and I sectors have dominated energy use for decades, although the relative share of R and C sectors has increased of late.
The next chart breaks down 2014 energy use in each sector by fuel type and further highlights the outsized impact on electric system losses in the R and C sectors. Also striking is that only about 55 percent and 49 percent of total energy goes to actual end-uses in the R and C sectors, respectively. This is due to the large proportion of electricity use in those sectors, and previews a topic of a future post in this series detailing where deeper savings might be realized.

The Residential Sector
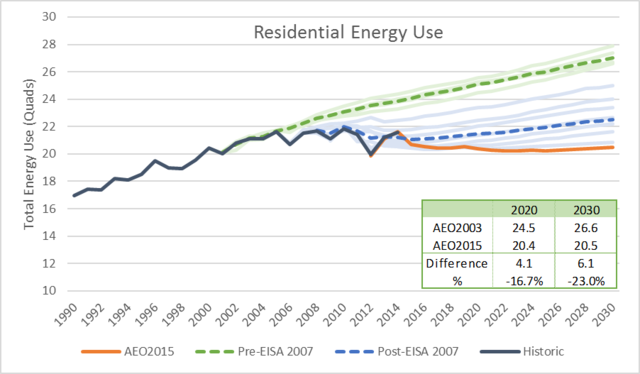
The residential (R) sector encompasses the energy use of all household activity in the country. Over time, energy use in the R sector has fallen in a similar manner as total U.S. energy use has fallen. If anything, the EISA delineation point is more stark in this sector; energy use forecasts started to fall immediately after the passage of the act after having stalled for many years before it. Further, incremental savings are projected in each successive AEO forecast, resulting in the lowest forecast in AEO2015. This trend is due in large part to EISA’s expansion of appliance and lighting standard categories, as well as continued strengthening of building codes and appliance standard regulations already in place in the years since. These actions, combined with increased state support of programs such as utility-based energy efficiency programs and EERS, result in essentially flat projections of R energy use through 2030.
More remarkable, this is accomplished while the total number of households is projected to increase 14 percent and the average square footage per household is projected to increase 6 percent between 2015 and 2030. In other words, households are forecasted to use almost 20 percent less energy on a per square foot basis than they do today. The policies and programs that are driving these reductions are putting money back into the pockets of residents.
The Commercial Sector
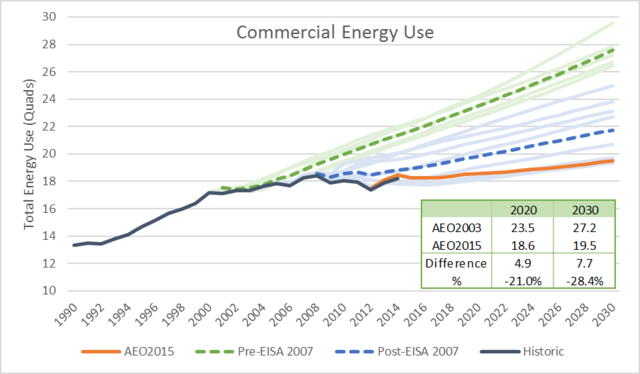
The commercial (C) sector graph looks very similar to the R sector chart, with good reason. For the most part, the end uses in the R and C sector are similar – space heating, space cooling, lighting, etc. Differences exist in the relative share of energy use between the two sectors, but they share much more in common than either does with the I or T sectors. The “falling over” of the forecast is also clear and has been driven by many of the same policies: appliance standards, building codes, utility-rebate programs and EERS. Commercial spaces have benefitted substantially from lighting retrofits as they tend to operate a higher number of hours per day than do homes.
One will note that the C sector forecast from AEO2015, while still the lowest on the chart, is not quite as flat as the R sector. Two factors may contribute to this. First, the growth rate in commercial square footage is lower than the growth in residential space (17 percent vs. 21 percent). Given that newer buildings perform better than older buildings (due to the aforementioned building code improvements), a slower addition of newer, more energy-efficient buildings does not bring down the C sector average energy use as quickly as it does in the R sector. Secondly, the “other use” category (items such as elevators, coffee makers and water services) is much larger in the C sector than in the R sector, and is disproportionately powered by electricity. As we saw earlier, for each unit of electricity used on-site, two more are used to get the electricity there.
The Industrial Sector
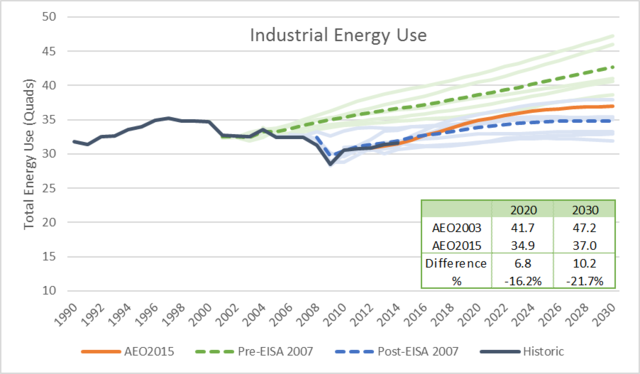
While the R and C graphs looked very similar to each other, the industrial (I) sector graph is a bit different. Here, we see more of the lowering of the forecasts, but not as dramatic of the flattening of the forecasts. This is also the only sector where AEO2015 is not the lowest on the chart.
A few observations can be made about the efforts in I sector energy efficiency as compared to the R and C sectors. First, while EISA and other federal policies have set mandatory standards for many appliances and building codes (although building code compliance is driven by states), most energy efficiency in the I sector is voluntary. Second, many industrial processes are already optimized to reduce energy waste, meaning the initial potential for reductions is lower than in the R and C sectors. Finally, EIA has gotten more bullish on industrial economic output in the past few years as we emerged from the Great Recession, so an increase in manufacturing output is more closely tied to increased I sector energy use.
This is not to say that industrial companies do not care about their energy consumption – in fact, quite the opposite is true! Energy is a major portion of the cost of goods sold for industrial companies – particularly those in energy-intense sectors such as steelmaking, refining and cement – and saving energy is critical to maintaining their competitiveness on the world stage. Industrial companies have driven down their energy intensity – or, put another way, driven up their energy productivity – dramatically over the past decades – but opportunities for future reductions in industrial energy use still exist. We will explore this in a later post.
The Transportation Sector
![]()
Finally, we arrive at the transportation (T) sector. As with the R and C graphs, there is a major distinction between the pre- and post-EISA forecasts. This is due largely to the increase and expansion of CAFE standards, which improved the economy of cars and light trucks, and the development of medium- and heavy-duty (MHD) vehicle standards found in the legislation. Combined with continued efforts to increase CAFE and MHD standards beyond 2020, the percentage drop in 2030 T sector energy use forecasts (45 percent) is the largest of any sector.
Specifically, EISA raised CAFE standards to 35 mpg by 2020, a significant change from their long-stagnant levels of 27.5 mpg. Since then, the EPA and the DOT have further increased CAFE standards, with the latest EPA standards having been set equivalent to a fleet-wide average of 54.5 mpg by 2025. And because 95 percent of energy in the T sector is from fossil fuels, decreasing our consumption in this sector pays major dividends in efforts to increase our country’s energy security.
Looking Forward
Policies enacted over the past 15 years have led to dramatic reductions in energy use throughout the economy. All major sectors of EIA’s forecasts show double-digit drops in projected energy use in 2020, with the transportation sector leading the way. And while the trends are certainly moving in the right direction, we will explore in our next part of this series that more can – and should – be done in the future to continue to increase energy savings and eliminate energy waste.


STAY EMPOWERED
Help the Alliance advocate for policies to use energy more efficiently – supporting job creation, reduced emissions, and lower costs. Contact your member of Congress.
Energy efficiency is smart, nonpartisan, and practical. So are we. Our strength comes from an unparalleled group of Alliance Associates working collaboratively under the Alliance umbrella to pave the way for energy efficiency gains.
The power of efficiency is in your hands. Supporting the Alliance means supporting a vision for using energy more productively to achieve economic growth, a cleaner environment, and greater energy security, affordability, and reliability.