How Have Major Federal Policies Shaped Our Energy Future?
Let's Save Energy
Alliance to Save Energy's Blog
This post is the first of a four-part series that will analyze the evolution of the Energy Information Administration’s Annual Energy Outlook forecasts to show how major federal policies have changed the shape of our energy future, how these and other policies have impacted certain sectors of the economy and where opportunities for additional savings remain untapped.
Studying projections of future energy use in the U.S., we see that something interesting has happened in the past 15 years – energy forecasts have fallen over! Each year, the Energy Information Administration (EIA) releases their Annual Energy Outlook (AEO), a yearly report that focuses on factors expected to shape U.S. energy markets. The evolution of AEO forecasts over time demonstrates the incredible value that energy efficiency policies and programs have provided to American residents and businesses, and shows that there continues to be ample opportunity to cut energy waste while increasing economic output.
First, some background on how EIA forecasts work. The projections of the AEO report are based on the National Energy Modeling System (NEMS), a modeling system that projects the impact of energy policies and energy markets on the United States. Importantly, EIA’s Reference case projection is based only on laws and regulations that are “on the books”, meaning proposed rules aren’t included in the forecast – only finalized rules. EIA also analyzes many alternative cases (such as high and low natural gas prices). As you might expect, comparing the relative results of different cases is often more instructive than trying to peg a single figure from a single forecast.
Finally, there is a lot of data that goes into EIA’s long-term projections, and that data takes a while to collect. Given the speed at which the market has been moving (such as the explosion of shale gas plays around 2009 and the rapid fall of oil prices recently), certain alternative cases might be closer to actual market-based price forecasts than the Reference case. All that said, AEO forecasts offer very telling insights into the energy profile of our economy.
The Evolution of Economy-Wide Energy Use Forecasts
This first chart shows the evolution of AEO’s Total Energy Use forecast for the Reference case between the 2003 edition (AEO2003) and the 2015 edition (AEO2015). It also shows actual historic energy use as a comparison point. AEO2003 to AEO2005 have been extended to 2030, and all data in this series will be in quadrillion Btus, or quads, unless otherwise noted.
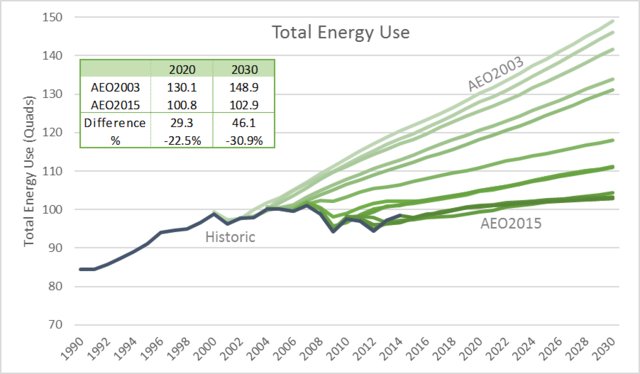
Today, predictions for 2020 energy use are dramatically lower than they were in 2003: in the span of twelve years, the forecast for 2020 energy use dropped by more than 22 percent, while the forecast for 2030 energy use dropped by almost 31 percent. It is hard to overstate the magnitude of these reductions – the energy that was avoided between the 2020 forecasts (29.3 quads) is more energy than the entire transportation sector of the economy used in 2014 (27.1 quads), and 36 percent more energy than the energy used by all the homes and apartments in the entire country in 2014! This represents literally hundreds of billions of dollars that residents and businesses won’t have to pay for energy and that can instead go to more productive uses.
The Outsized Influence of EISA
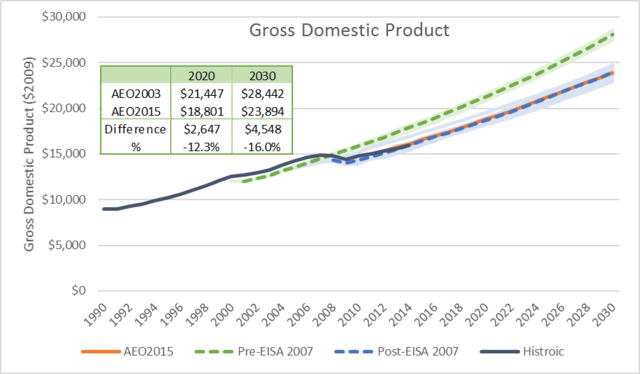
This next chart shows the same forecasts, but groups them together with averages taken before and after the Energy Independence and Security Act of 2007 (EISA). EISA contained many important policy provisions that impacted future energy use and increased efficiency: it established the first efficiency standards for medium- and heavy-duty vehicles and increased Corporate Average Fuel Economy (CAFE) standards for passenger vehicles, which improved the economy of cars and light trucks. It also directed the creation of new appliance and lighting efficiency standards and pushed for new initiatives to promote conservation in buildings and industry.
After its passage and incorporation into the AEO forecasts, the magnitude of the cumulative impacts of EISA start to show in the dramatic lowering and flattening of the consumption trajectory, or the projection of the amount of energy to be used in the country. AEO2015 is also highlighted to show the impact of continued improvements in codes and standards that have been implemented since EISA.

Of course, the reader might note that there was the small matter of the Great Recession about the same time EISA was passed. Readers might also question how much the economic downturn, rather than proactive energy policy, influenced reduced future energy use. After all, historically, one might think, GDP and energy use were intrinsically “coupled” – when one went up, so did the other.
The answer is that EIA did begin to incorporate the change in economic output into their models around this time. Generally, the long-term annual economic growth rate was projected to fall from roughly 3.0 percent before the Great Recession to about 2.4 percent after it.

Unsurprisingly, the decrease in annual growth resulted in a downward adjustment to future GDP figures. Forecasted GDP falls between the first and last AEO forecasts by about 12 percent in 2020 and about 16 percent in 2030.
Ah-ha! you say. Clearly, the forecast of GDP dropped, and given the “coupled” relationship between GDP and energy use, this must be the reason the forecasts flattened! But if you remember the energy reductions discussed above, you will realize that this chart does not tell the full story.
Energy Productivity Helps Answer the Great Recession Question
To see how – or whether – the decline in GDP affected energy use, one could do a sophisticated analysis that looked at how consumers change their behavior in recessions, how commodity price changes impacted purchasing decisions, and how business investments and expenditures changed across multiple sectors of the economy. There are groups who do just that (EIA among them), but that is a bit beyond the scope of this post. Instead, one can use a simpler metric that already embeds all of these factors by comparing the AEO aggregate output of the economy to the total energy use.
This metric, called energy productivity, represents the amount of economic activity that is enabled by one unit of energy. Energy productivity is a useful metric, as it increases (a good thing) when less energy is used for the same economic output or when the same energy input is used for more economic output. It is a useful, high-level metric that shows how effective the economy is at converting energy input into economic output. In other words, increasing energy productivity means that we are getting more economic bang for our energy buck – using less energy to produce more.

What we see in this chart is that, despite the economic downturn, energy productivity has been steadily increasing through the analyzed time period. This implies that while GDP growth “paused” during the Great Recession and likely had some influence on the fall in forecasted energy use, the economy continued to become more efficient at producing economic output per unit of energy consumed. By 2014, energy productivity had already grown almost 7 percent from the depths of the recession. In fact, energy productivity projections from the latest AEO forecast is the highest on the chart, indicating that incremental policies enacted each year are helping contribute to the improvement in economic efficiency.
‘Till Next Time
To close out this post, I’ll leave you with a few thoughts. While EIA’s AEO Reference case forecasts tend to be conservative on technological and policy change, they are useful tools to see how the addition (or repeal) of policies shapes energy use. Energy policies that have been put into place in the past 15 or so years have contributed substantially to the efficiency of economy, both in terms of extracting output per unit of energy input (i.e. energy productivity), and in “bending the curve” on the absolute quantity of energy used. And while the Great Recession damped energy use for a few years, the underlying gains in energy productivity are real and continue to improve.
In the next post, I’ll dig into some of AEO’s sector-specific forecasts to see how these have evolved over time.


STAY EMPOWERED
Help the Alliance advocate for policies to use energy more efficiently – supporting job creation, reduced emissions, and lower costs. Contact your member of Congress.
Energy efficiency is smart, nonpartisan, and practical. So are we. Our strength comes from an unparalleled group of Alliance Associates working collaboratively under the Alliance umbrella to pave the way for energy efficiency gains.
The power of efficiency is in your hands. Supporting the Alliance means supporting a vision for using energy more productively to achieve economic growth, a cleaner environment, and greater energy security, affordability, and reliability.